Climate Change Maps
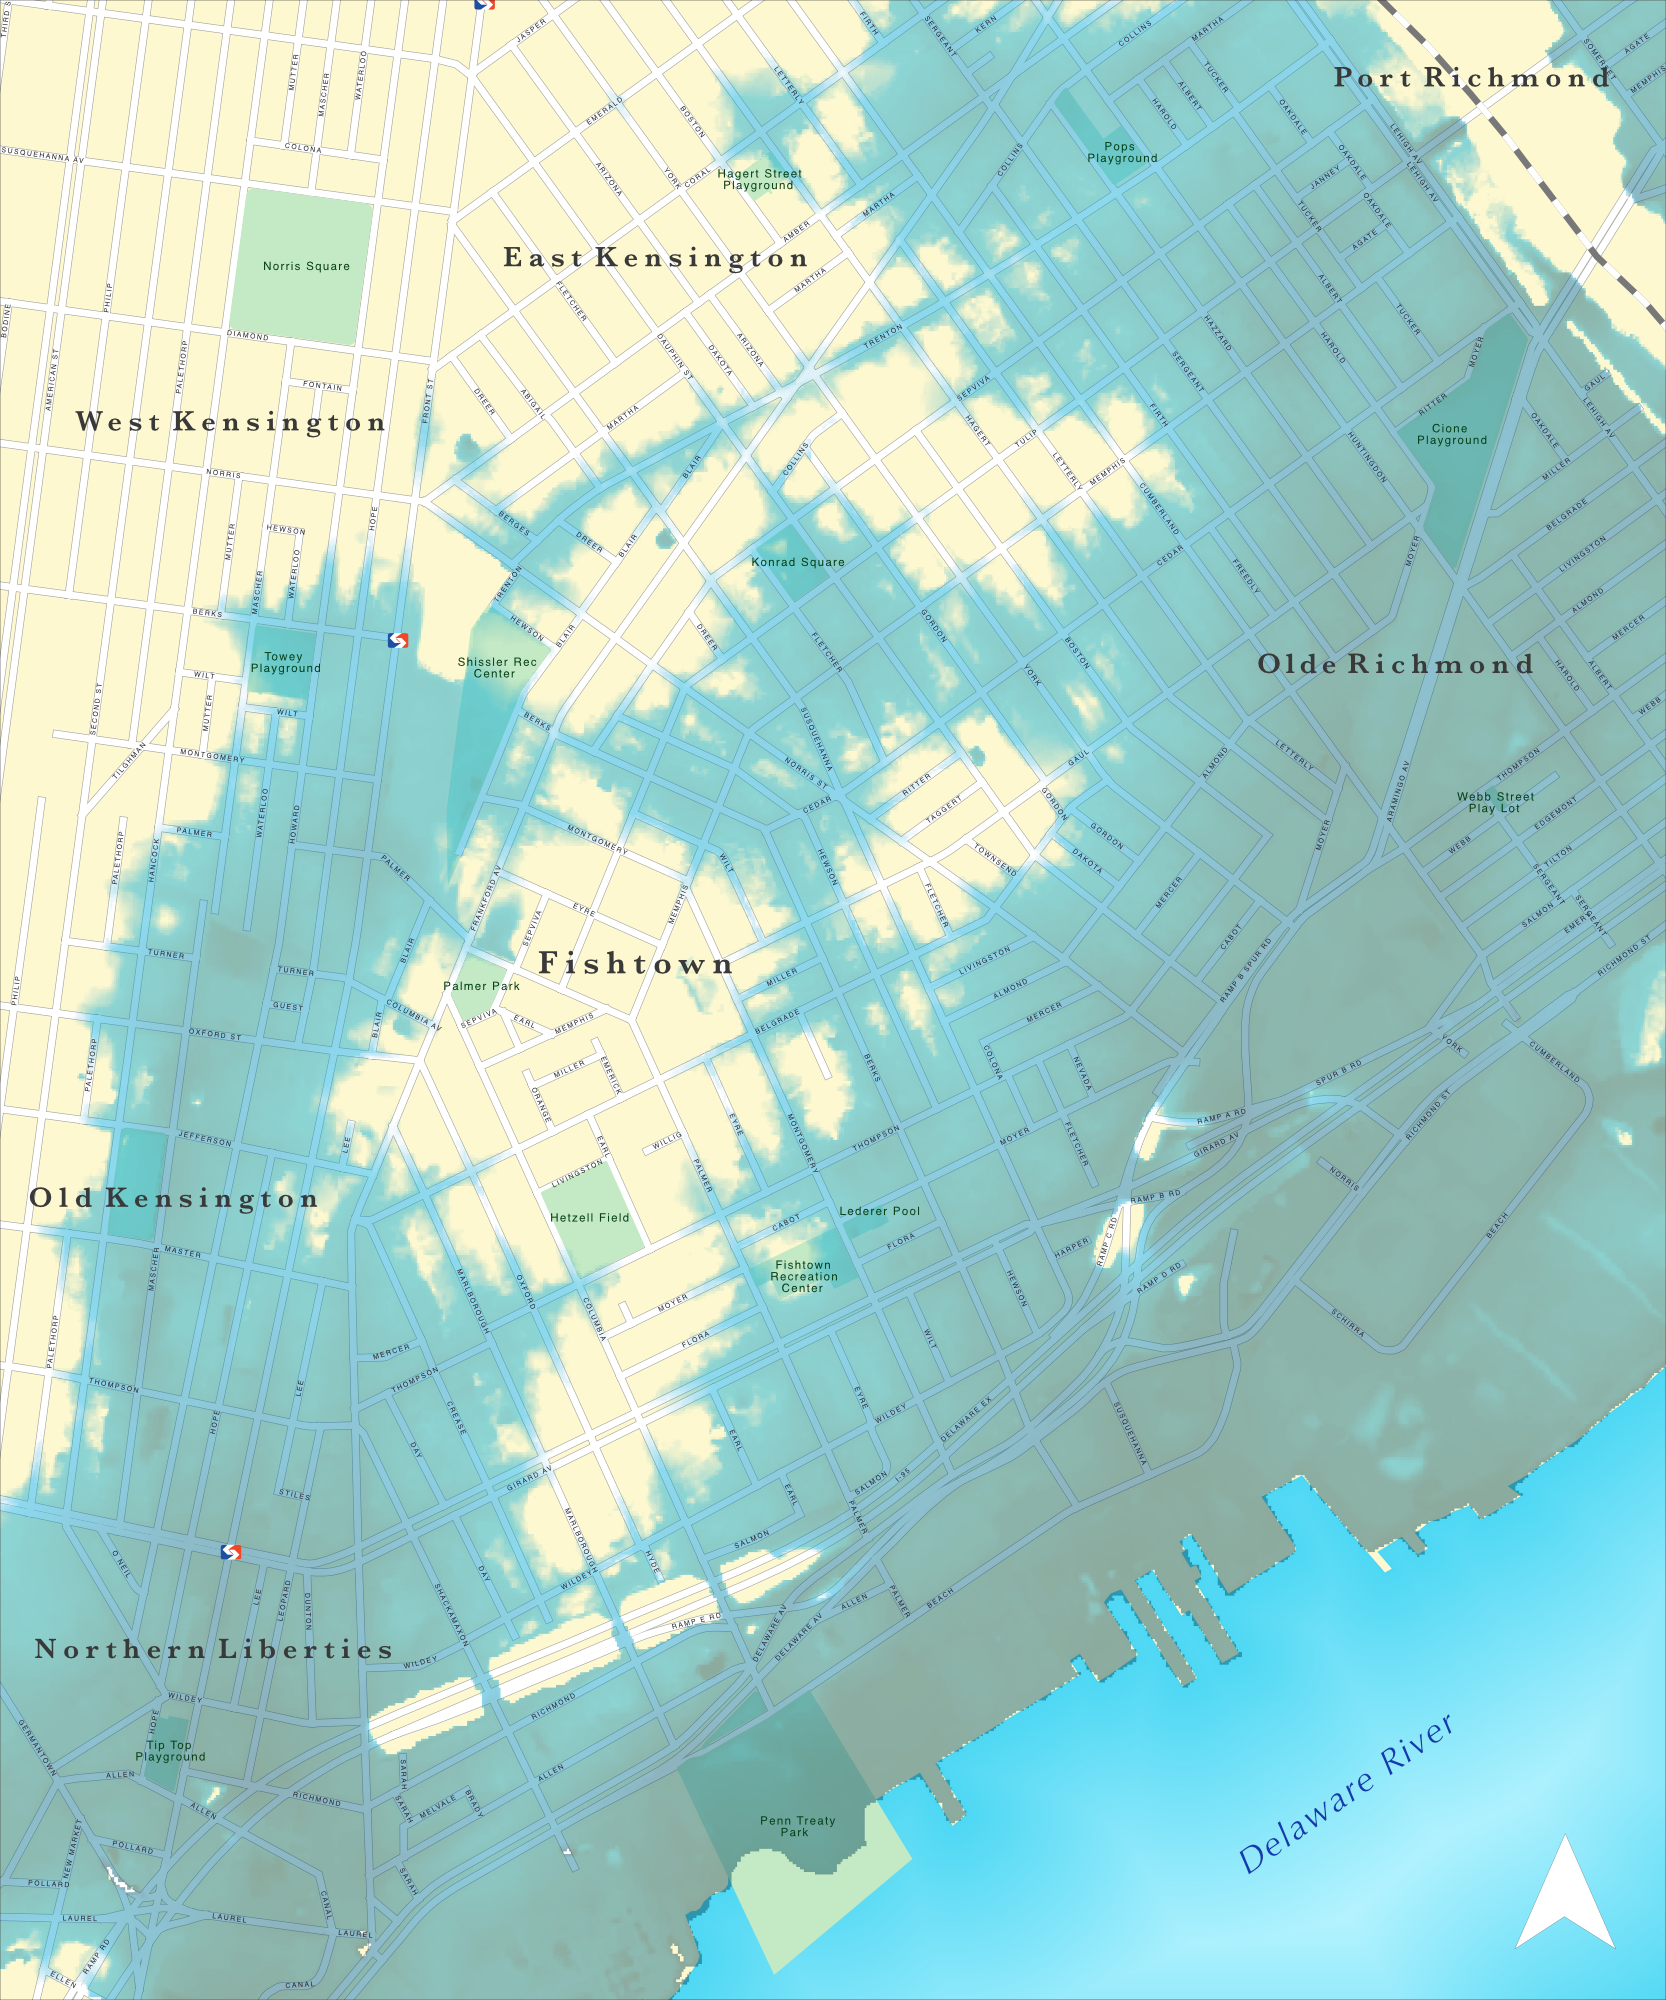
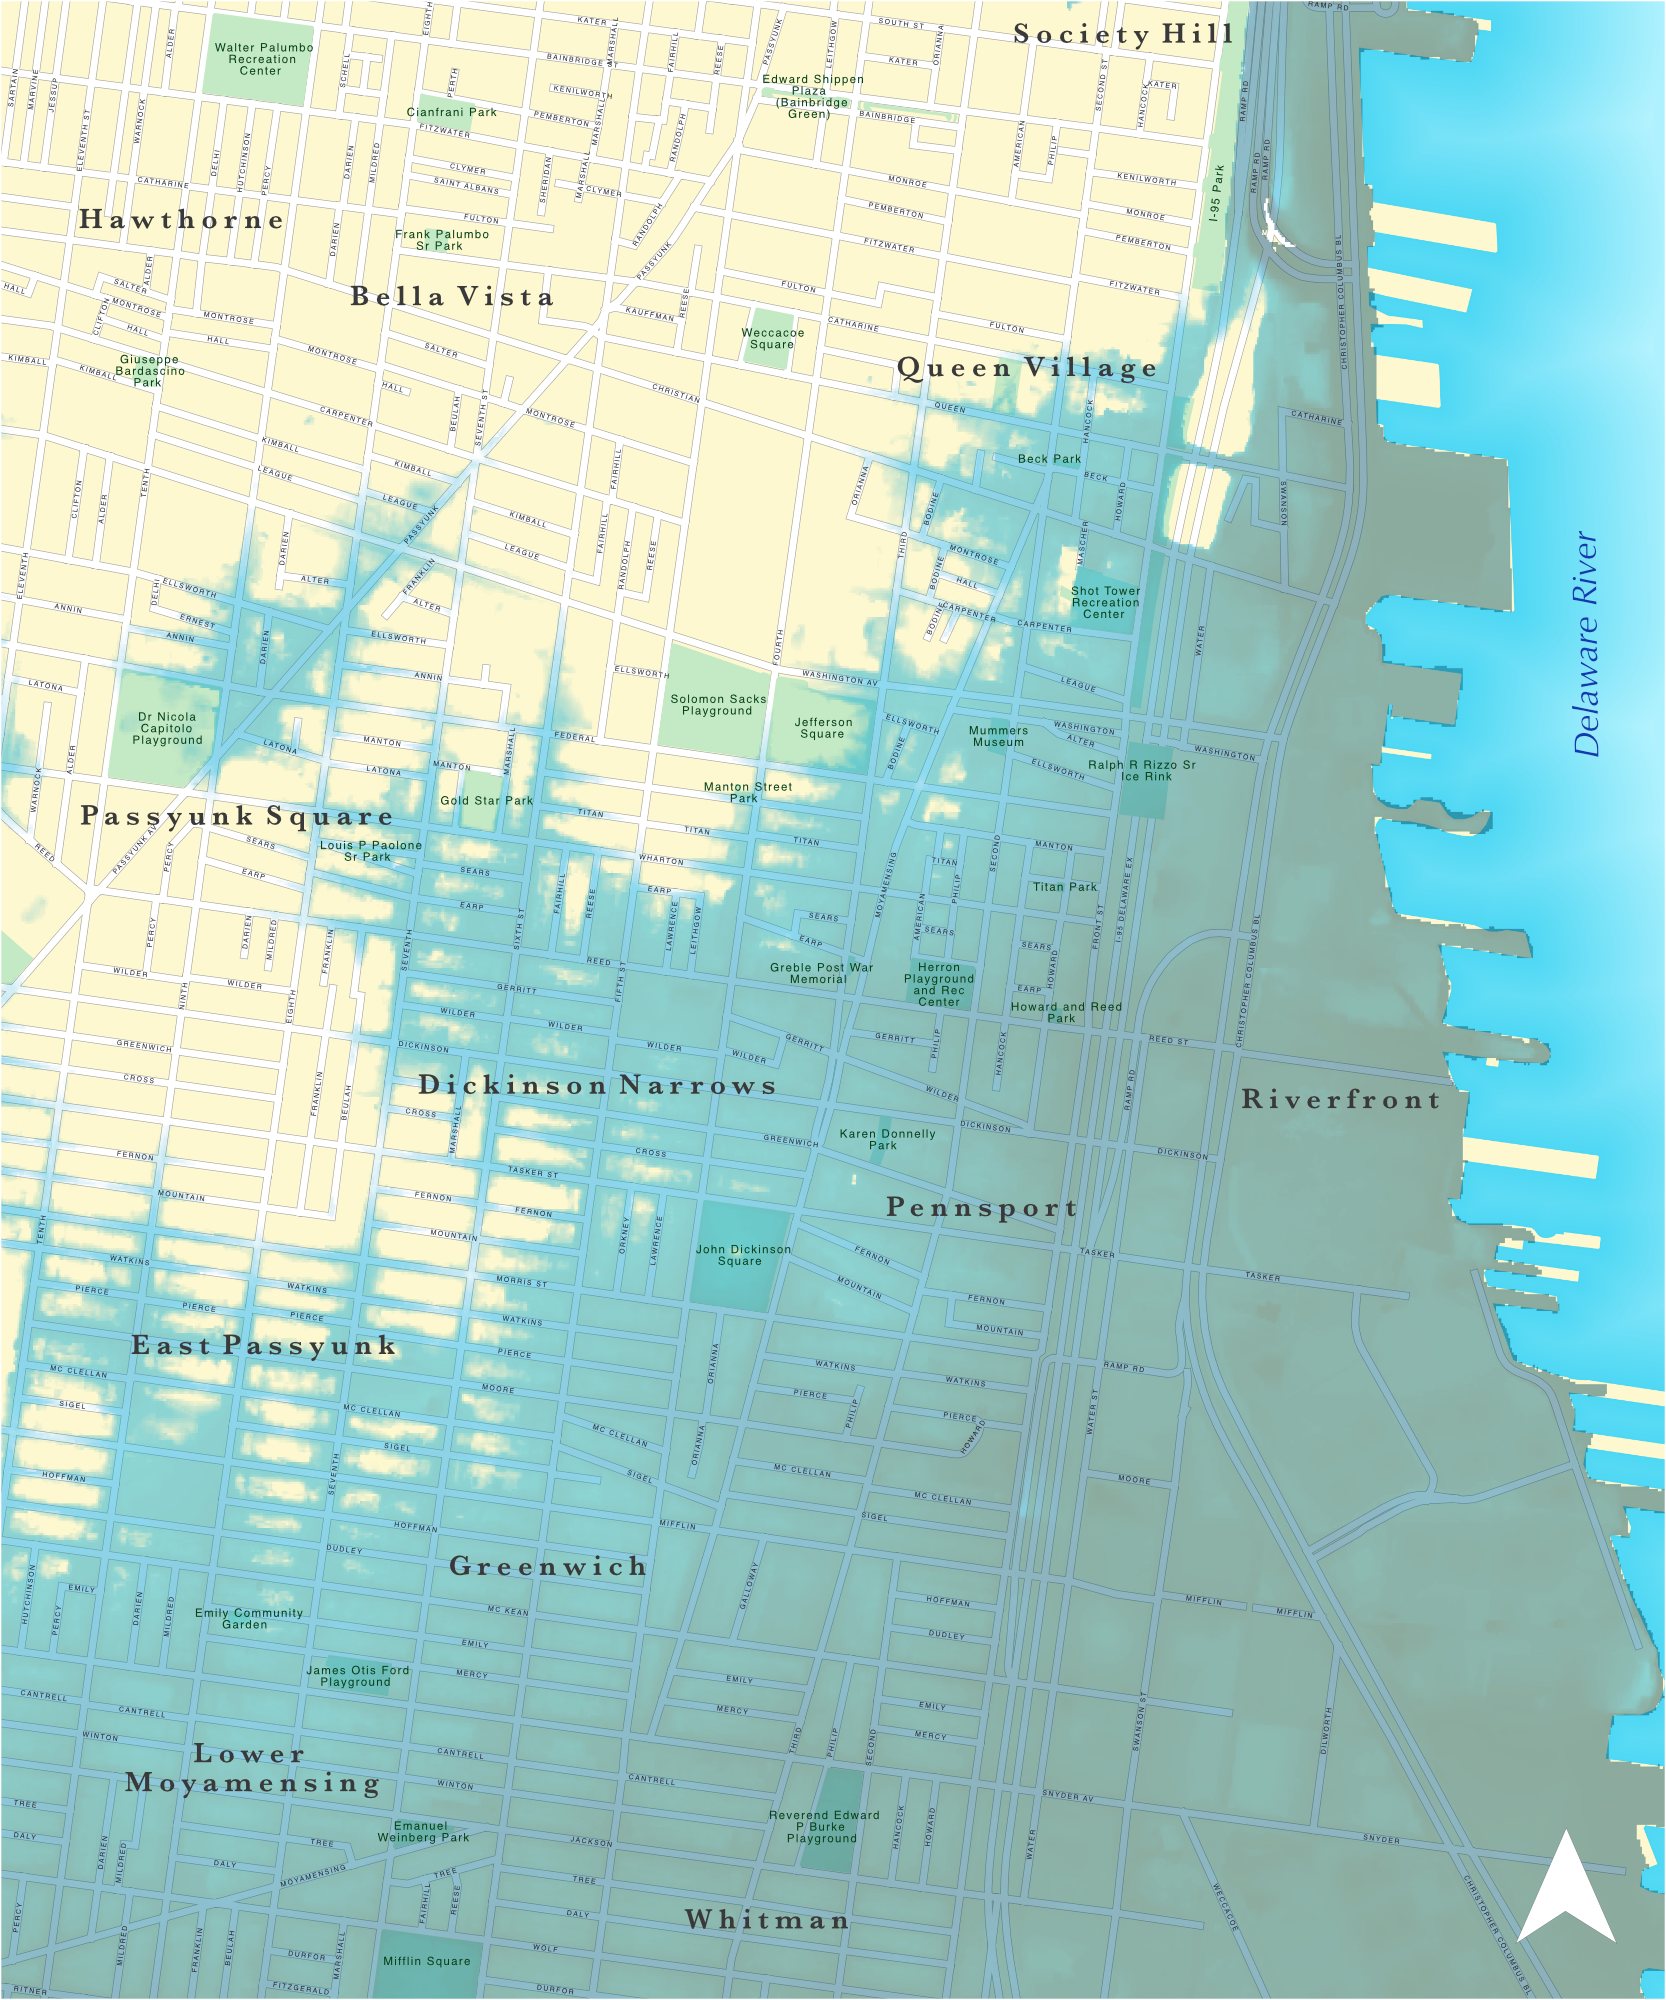
I recently contributed two very large maps to FEMA: Fear Environmental Mayhem Ahead, an exhibition whose goal was to draw attention to the looming crisis that climate change presents. We decided to create maps of flooded Philadelphia neighborhoods to demonstrate that this is not just a worry for small islands, but a problem that will affect us directly.
These maps were printed at 80x96 inches on sheer polyester, so this project was a welcome change of pace from creating digital maps sized for small computer screens. Working at such a massive scale was a welcome challenge, and required thinking differently about layout and size of map elements.
It’s important to note that this is art, not science. The flood layer was manually created from elevation data, and is not based on any particular sea level model. I’m happy to share the QGIS project and geopackage if anyone wants to do something else with this data
Maps
Map Info
Coordinate Reference System: State Plane Pennsylvania South
Software used: QGIS 3.14 and Affinity Designer
Data Sources
PASDA
DVRPC
OpenDataPhilly
NOAA’s Sea Level Rise Data Download


