philadelphia

Climate Change Maps

I recently contributed two very large maps to FEMA: Fear Environmental Mayhem Ahead, an exhibition whose goal was to draw attention to the looming crisis that climate change presents. We decided to create maps of flooded Philadelphia neighborhoods to demonstrate that this is not just a worry for small islands, but a problem that will affect us directly.

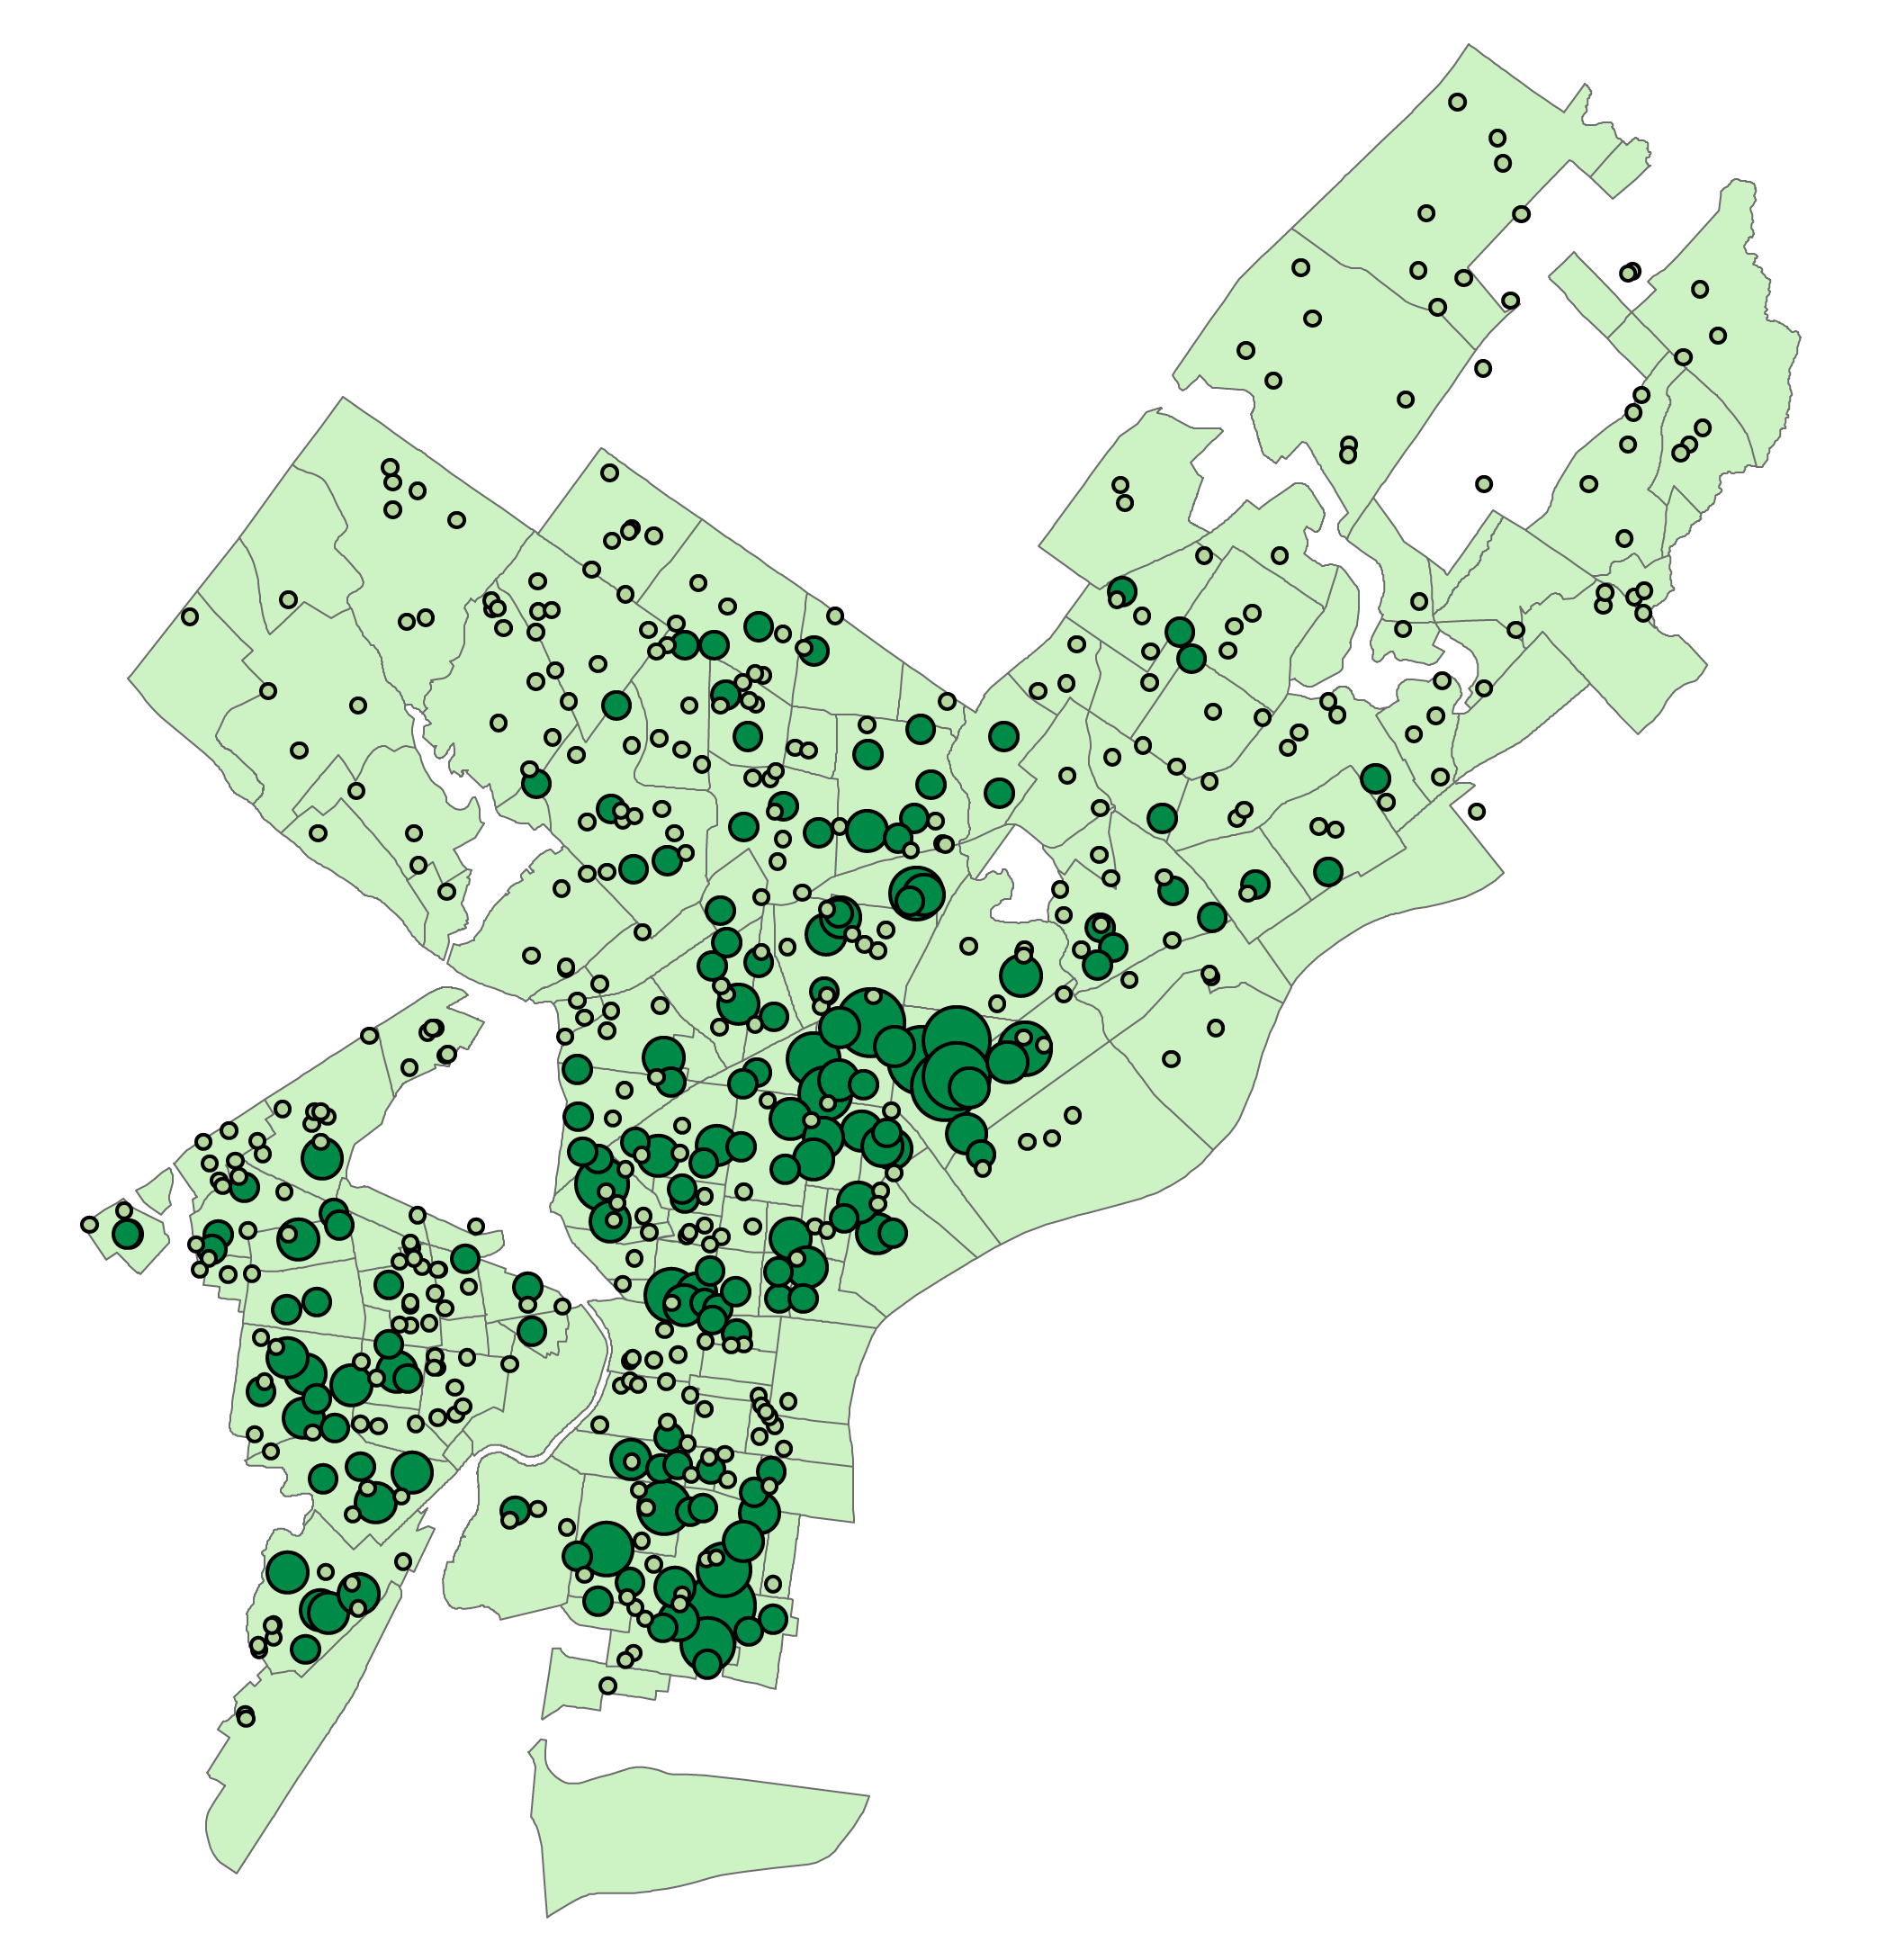
Figure 1

Controlling ArcGIS Desktop with Python

Intro

As part of Temple University’s GIS Application Development with Python class, this project was completed as part of the final project. The goal was: create one python script to download and decompress all necessary data, use the ArcPy package to perform some spatial analysis with ArcGIS Desktop, and create a map using the arcpy.mapping module. The mapping module is pretty limited, so the programmatically created map is not a finished product.

I decided to analyze the distribution of healthy corner stores within 300 Meters of each school in Philadelphia using publicly available data.

Figure 1

Arcadia Commons

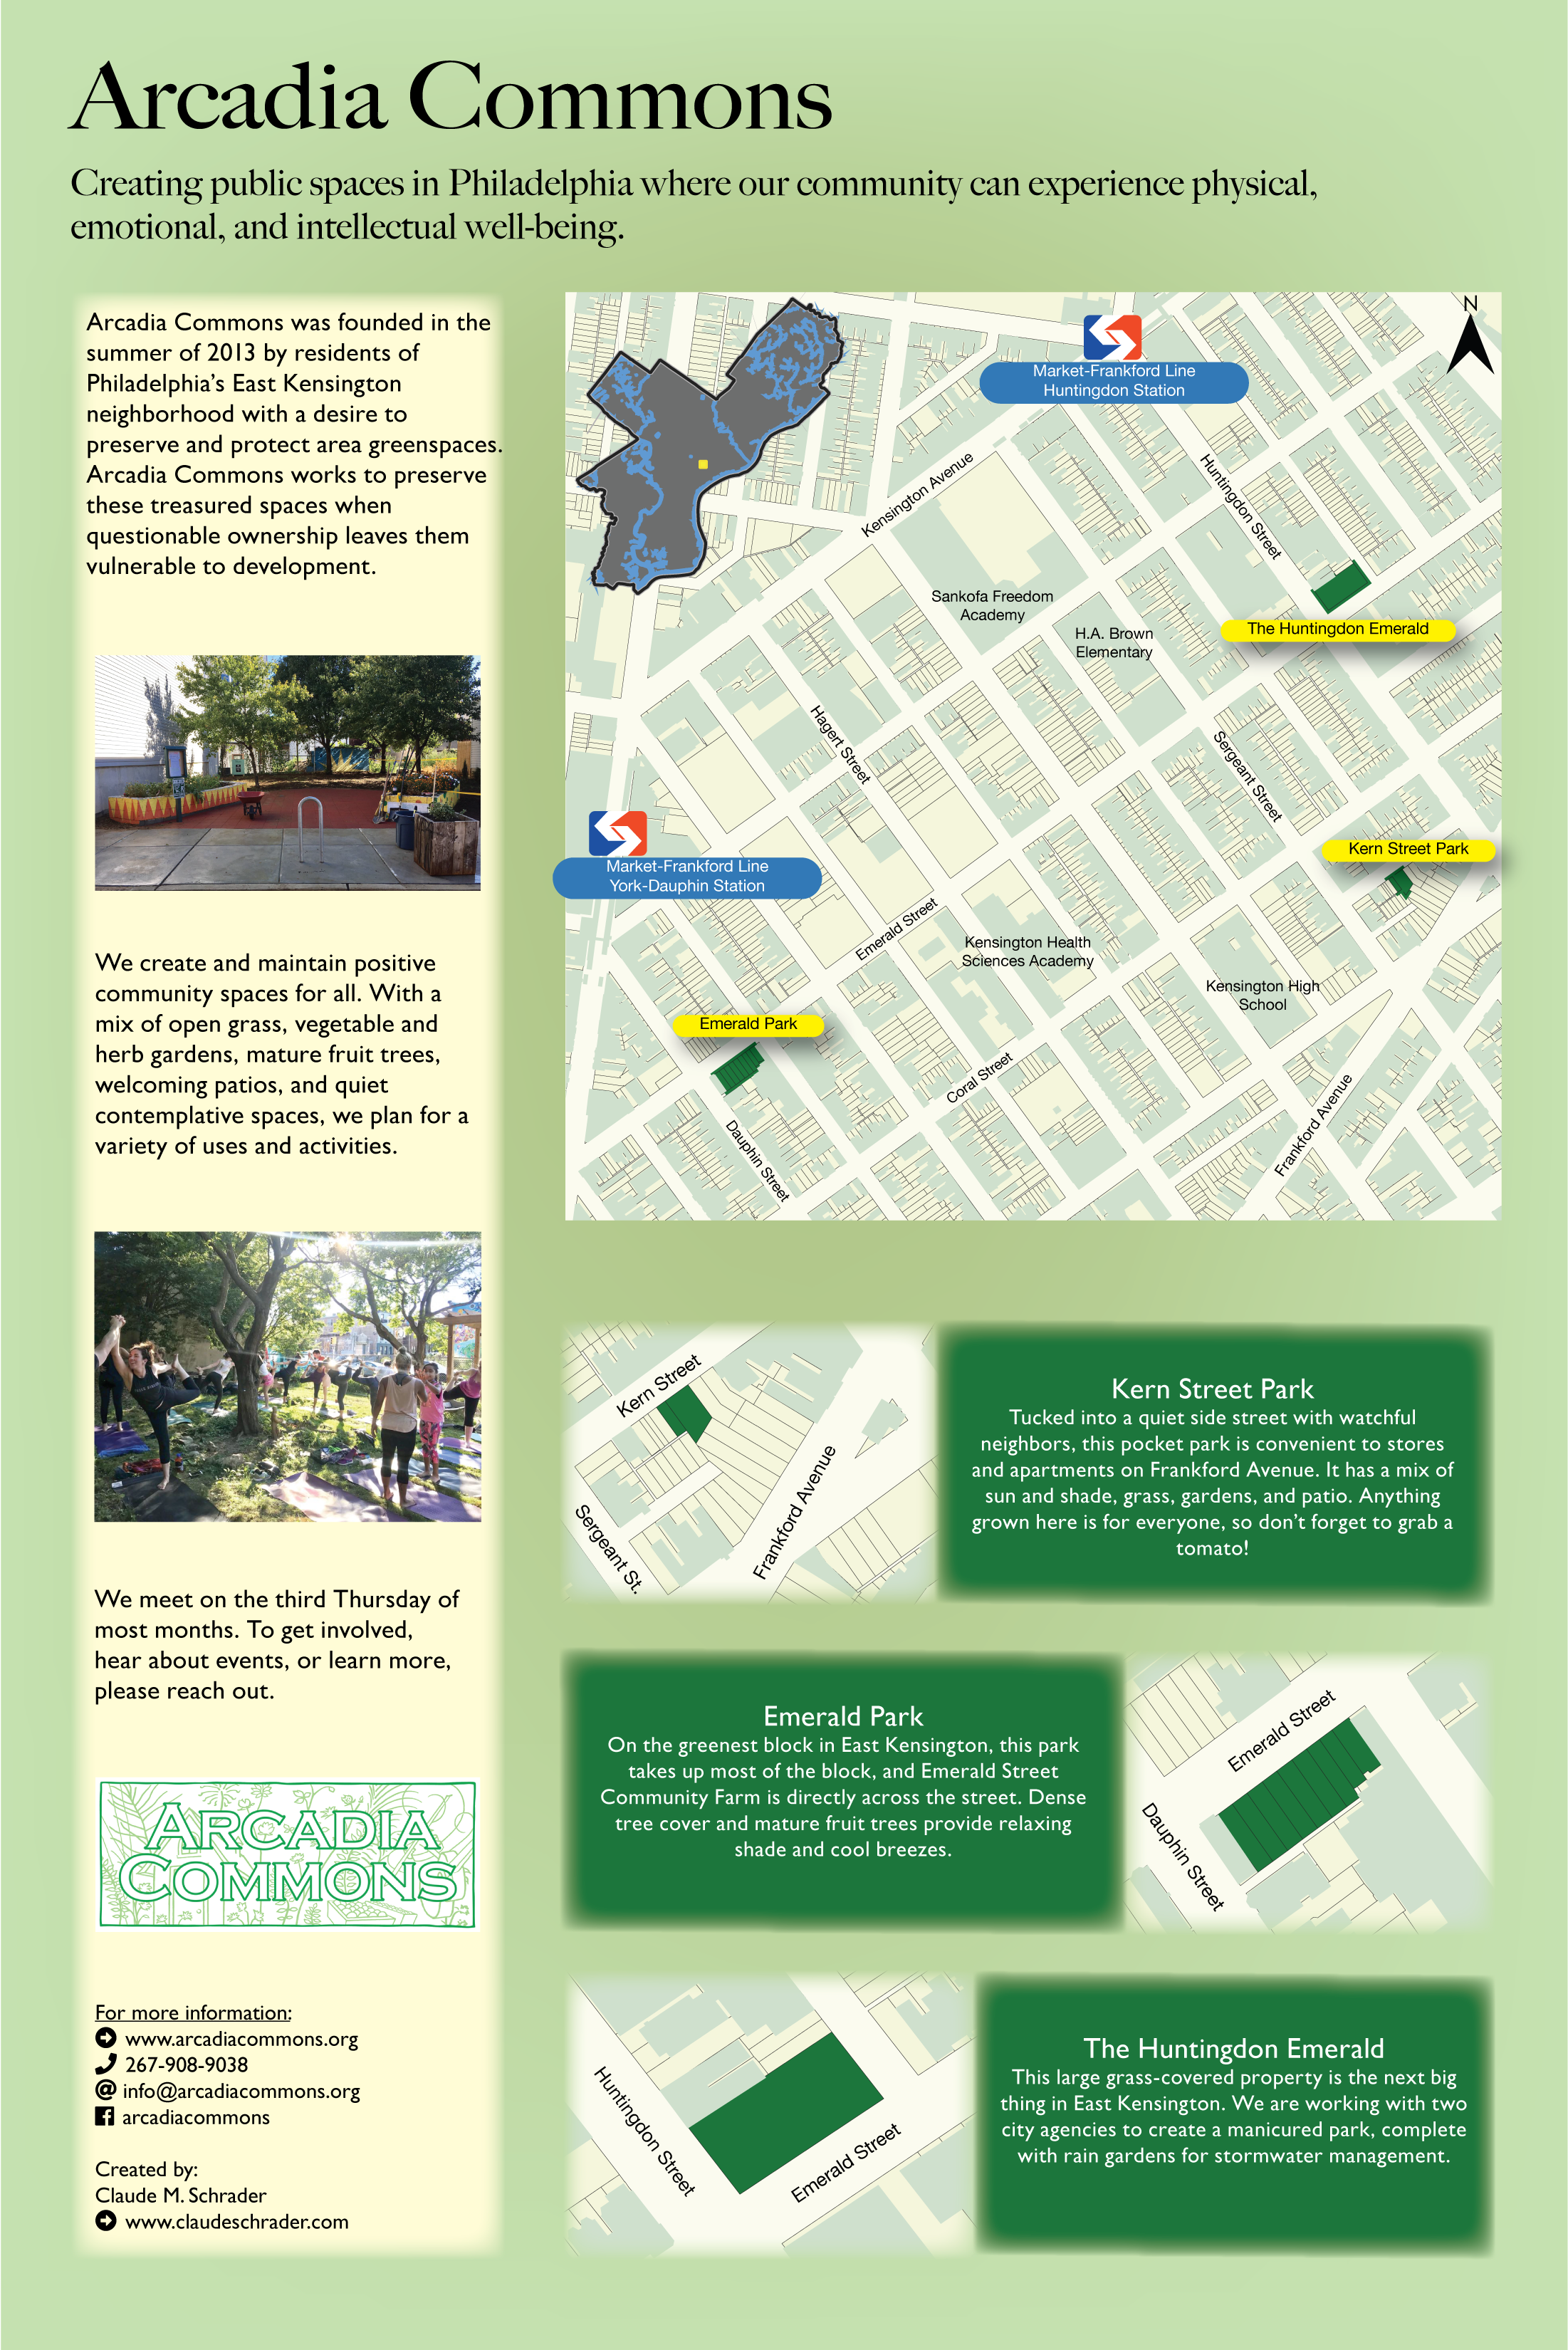
I’m on the board of Arcadia Commons, a local nonprofit formed in 2013 to protect and care for greenspaces around East Kensington. This is a large poster I created to help visualize our area of focus, and the organization’s mission.

Figure 1

ETL Transformation to Third Normal Form for Philadelphia Building Demolition Permits

Figure 5

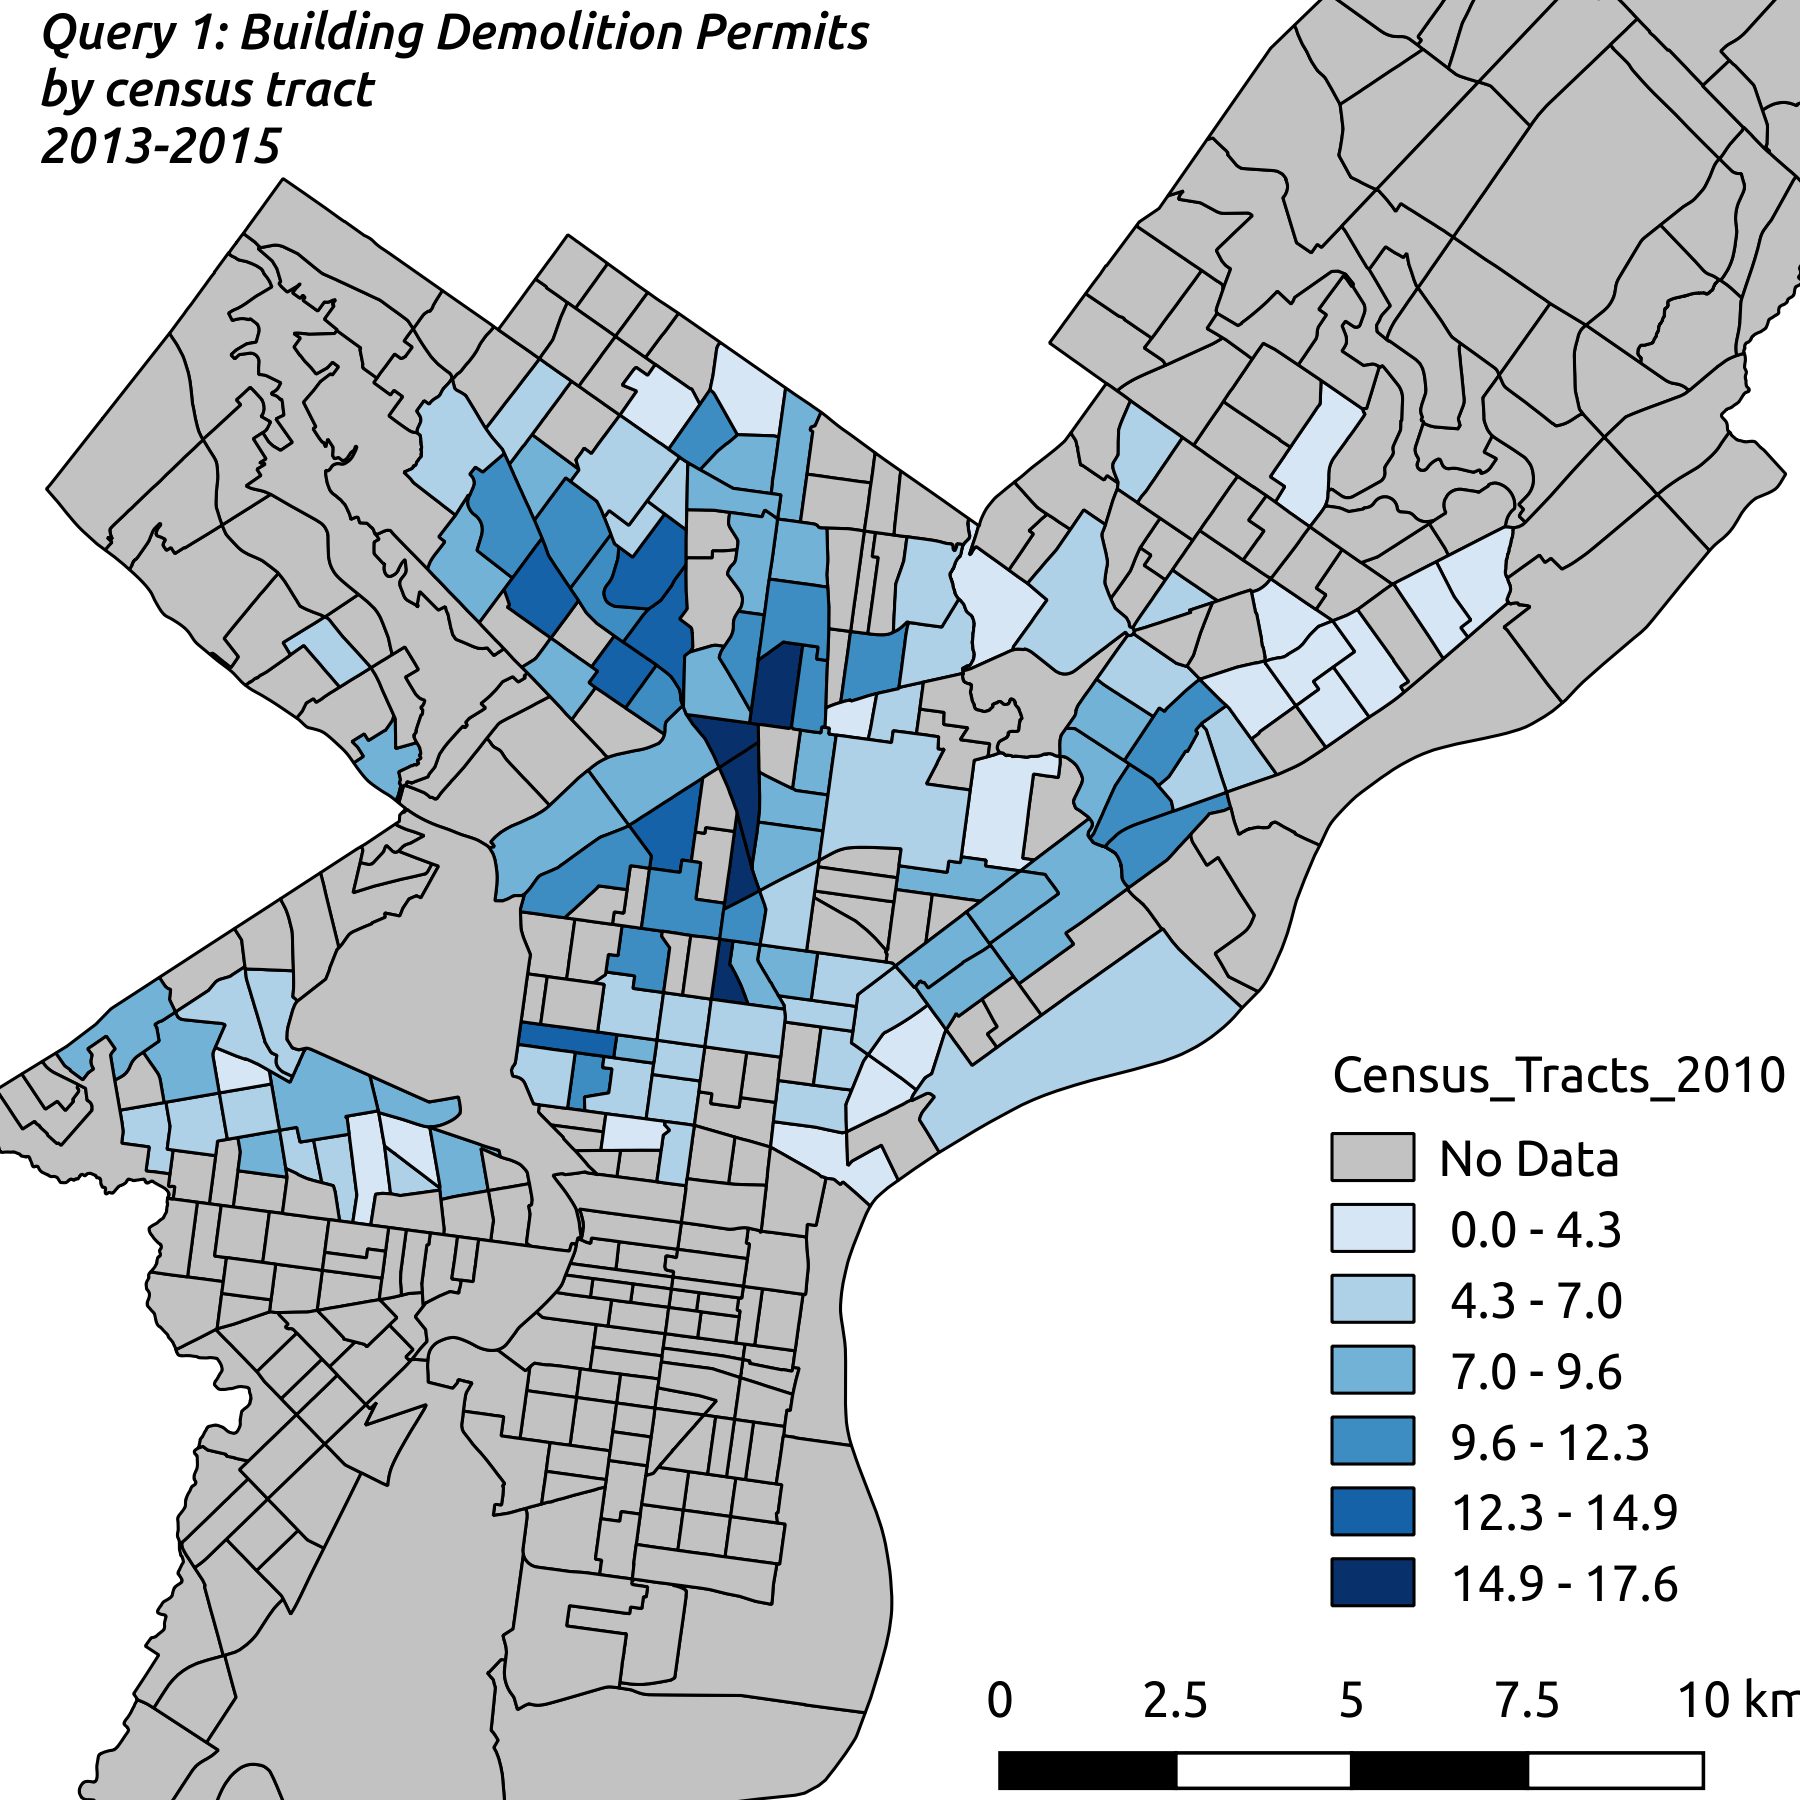
This ETL transformation was performed as an exercise in demonstrating proficiency using SQL in the PostgreSQL relational database with the PostGIS spatial extensions. I selected a spatial dataset of building demolition permits to load into the database and normalize to Third Normal Form. Once in place, this data can be combined with a secondary dataset on children with elevated blood lead levels to investigate correlations between demolition activity and elevated lead levels.