Recent posts

Climate Change Maps

I recently contributed two very large maps to FEMA: Fear Environmental Mayhem Ahead, an exhibition whose goal was to draw attention to the looming crisis that climate change presents. We decided to create maps of flooded Philadelphia neighborhoods to demonstrate that this is not just a worry for small islands, but a problem that will affect us directly.
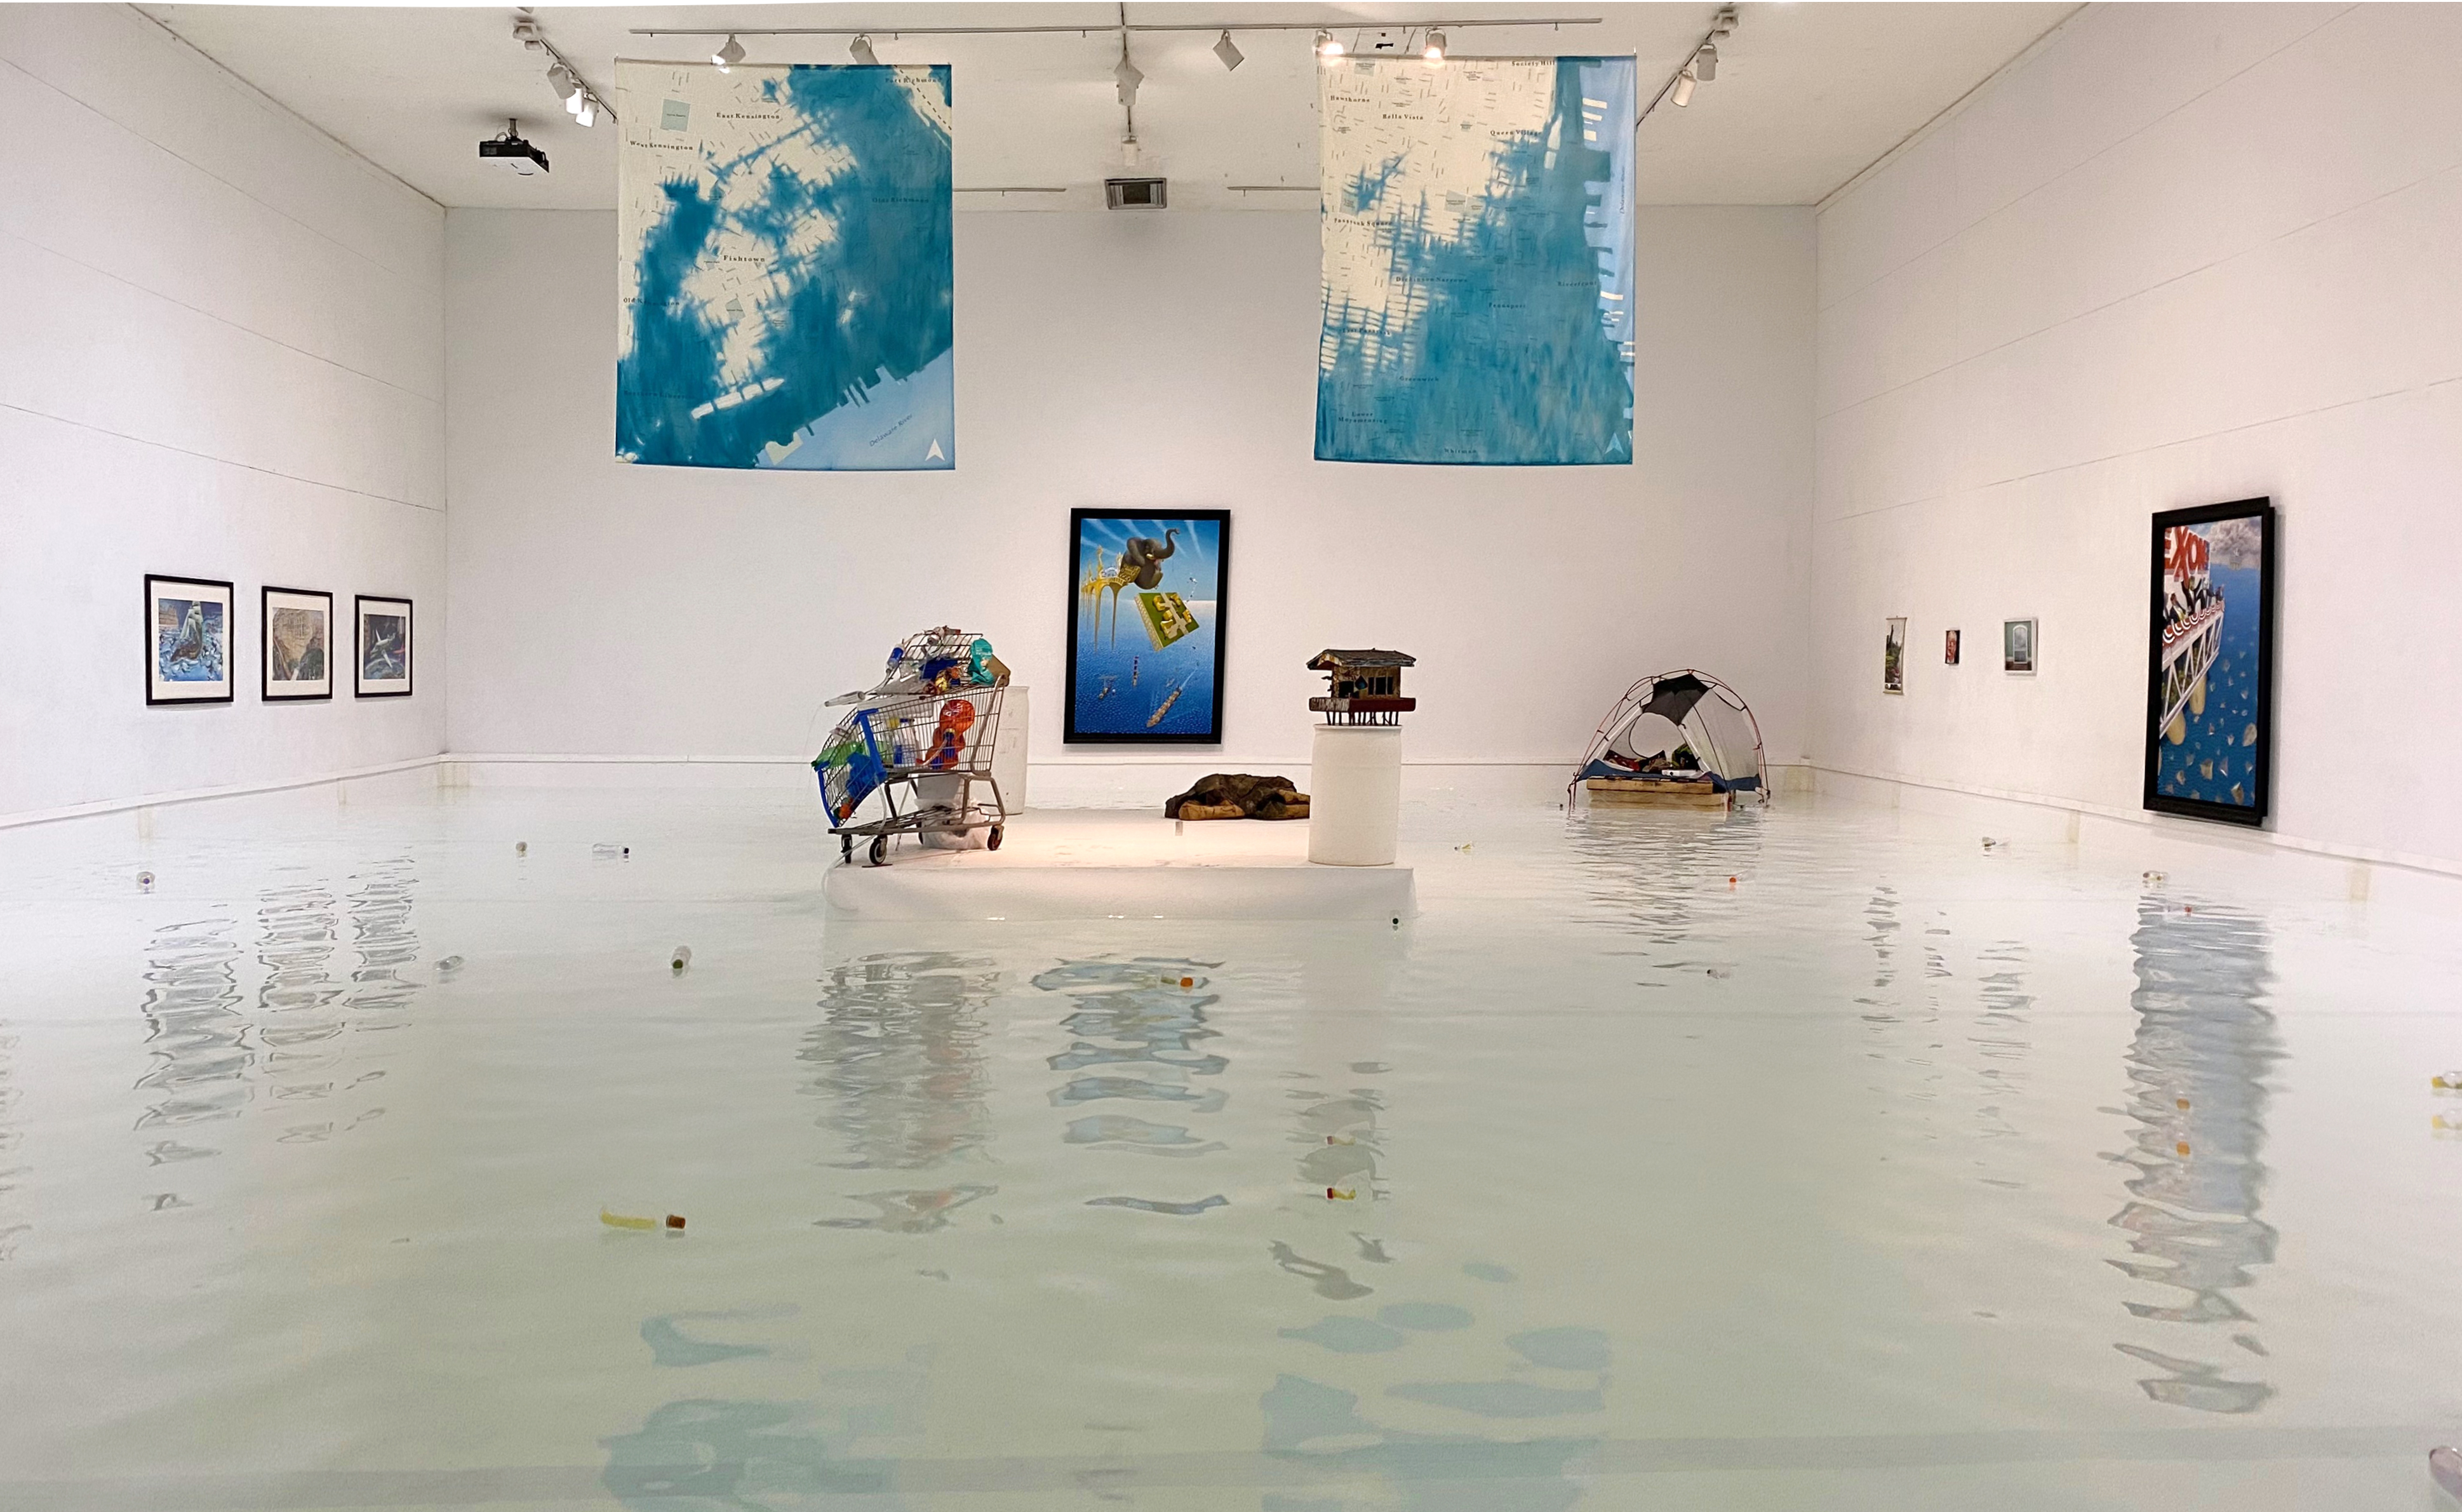
Figure 1

Part 2: Creating a Classified map of the Colombian Wetlands using Keras and and Tensorflow

This is Part two of a report on a capstone project performed with Victor Gutierrez-Velez in the Remote Sensing and Sustainability Lab at Temple University. We will discuss our work expanding and customizing the model created by reachsumit in order to classify imagery of the Colombian wetlands obtained from Planet Labs.

Part One of this report provided an introductory tutorial on training and using a Deep Learning model to create a classified map using image segmentation.

Part 1: TUTORIAL: Creating a Classified Map Using Keras and Tensorflow

In my research with Victor Gutierrez-Velez in the Remote Sensing and Sustainability Lab at Temple University, this project involved investigating the applicability of Deep Learning and Neural Networks for automatically classifying high-resolution multi-spectral remote sensing imagery of wetlands in Colombia. This work was performed as part of my capstone project as a culmination of a Professional Science Master’s in GIS from the Department of Geography and Urban Studies at Temple University.

This post contains Part 1 of the report, and will walk through building a model using Python, Keras, and Tensorflow, and creating a classified map using code created by github user reachsumit.

Controlling ArcGIS Desktop with Python

Intro

As part of Temple University’s GIS Application Development with Python class, this project was completed as part of the final project. The goal was: create one python script to download and decompress all necessary data, use the ArcPy package to perform some spatial analysis with ArcGIS Desktop, and create a map using the arcpy.mapping module. The mapping module is pretty limited, so the programmatically created map is not a finished product.

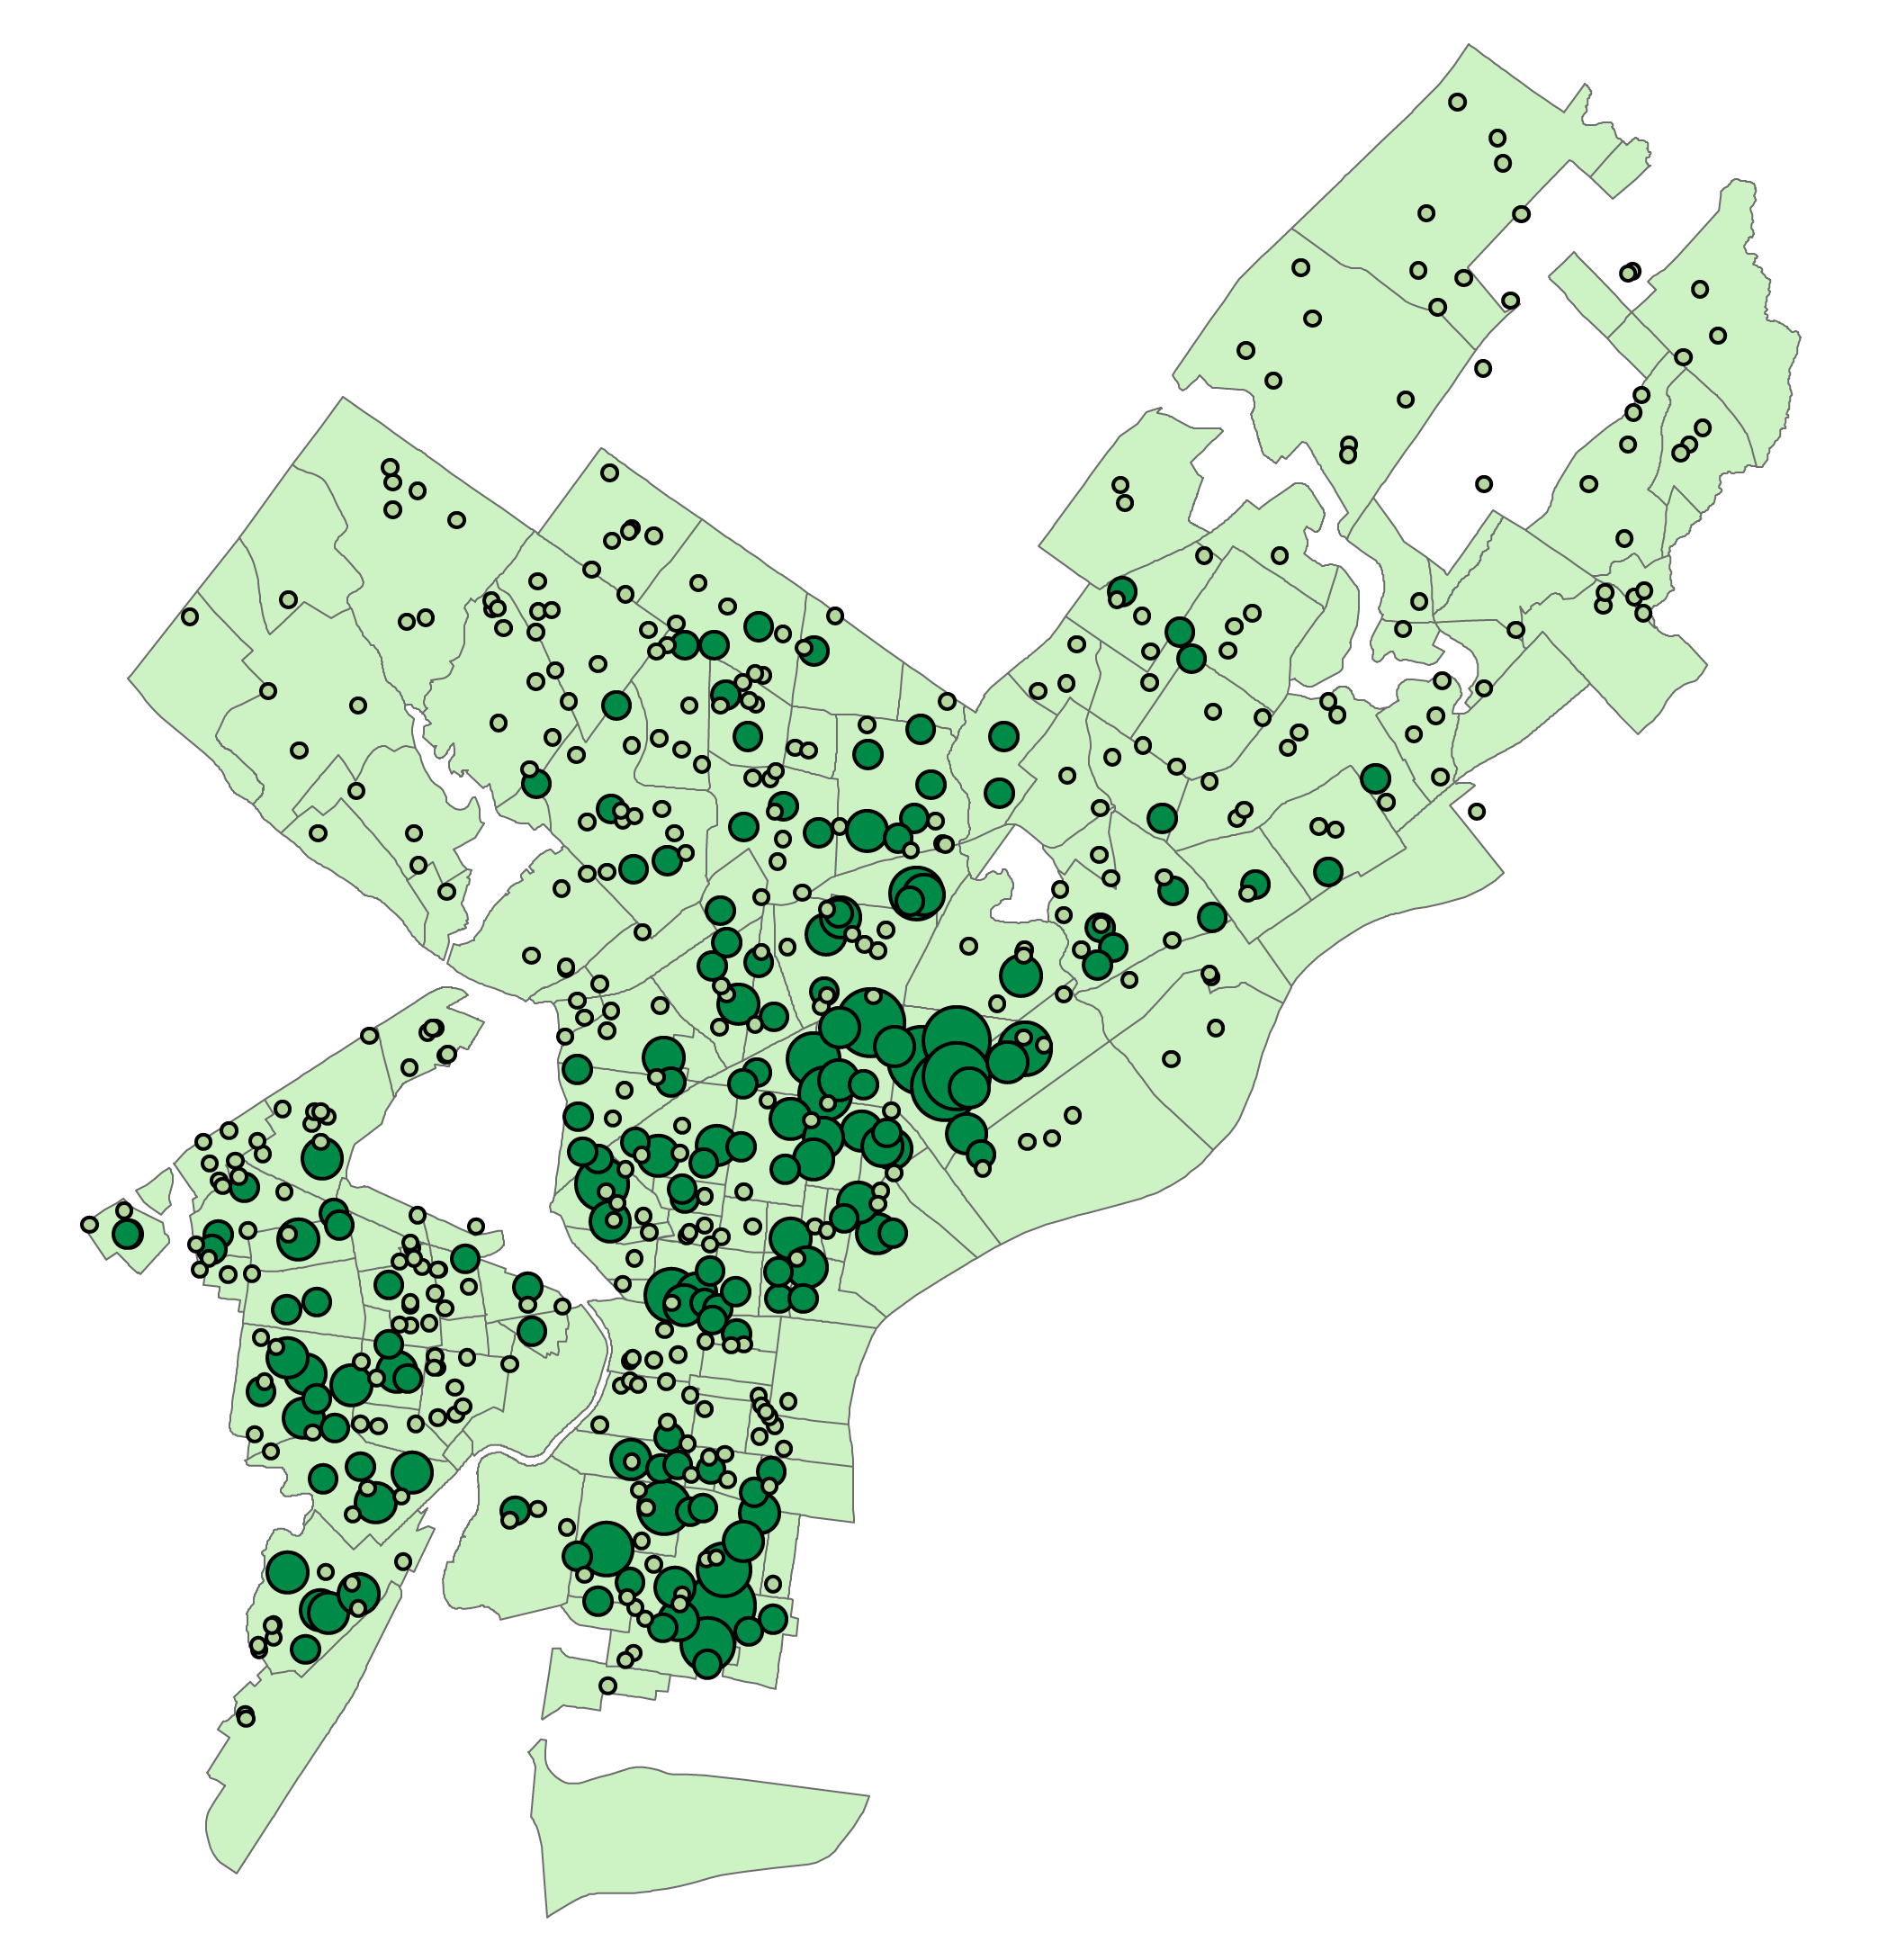
I decided to analyze the distribution of healthy corner stores within 300 Meters of each school in Philadelphia using publicly available data.

Figure 1

Arcadia Commons

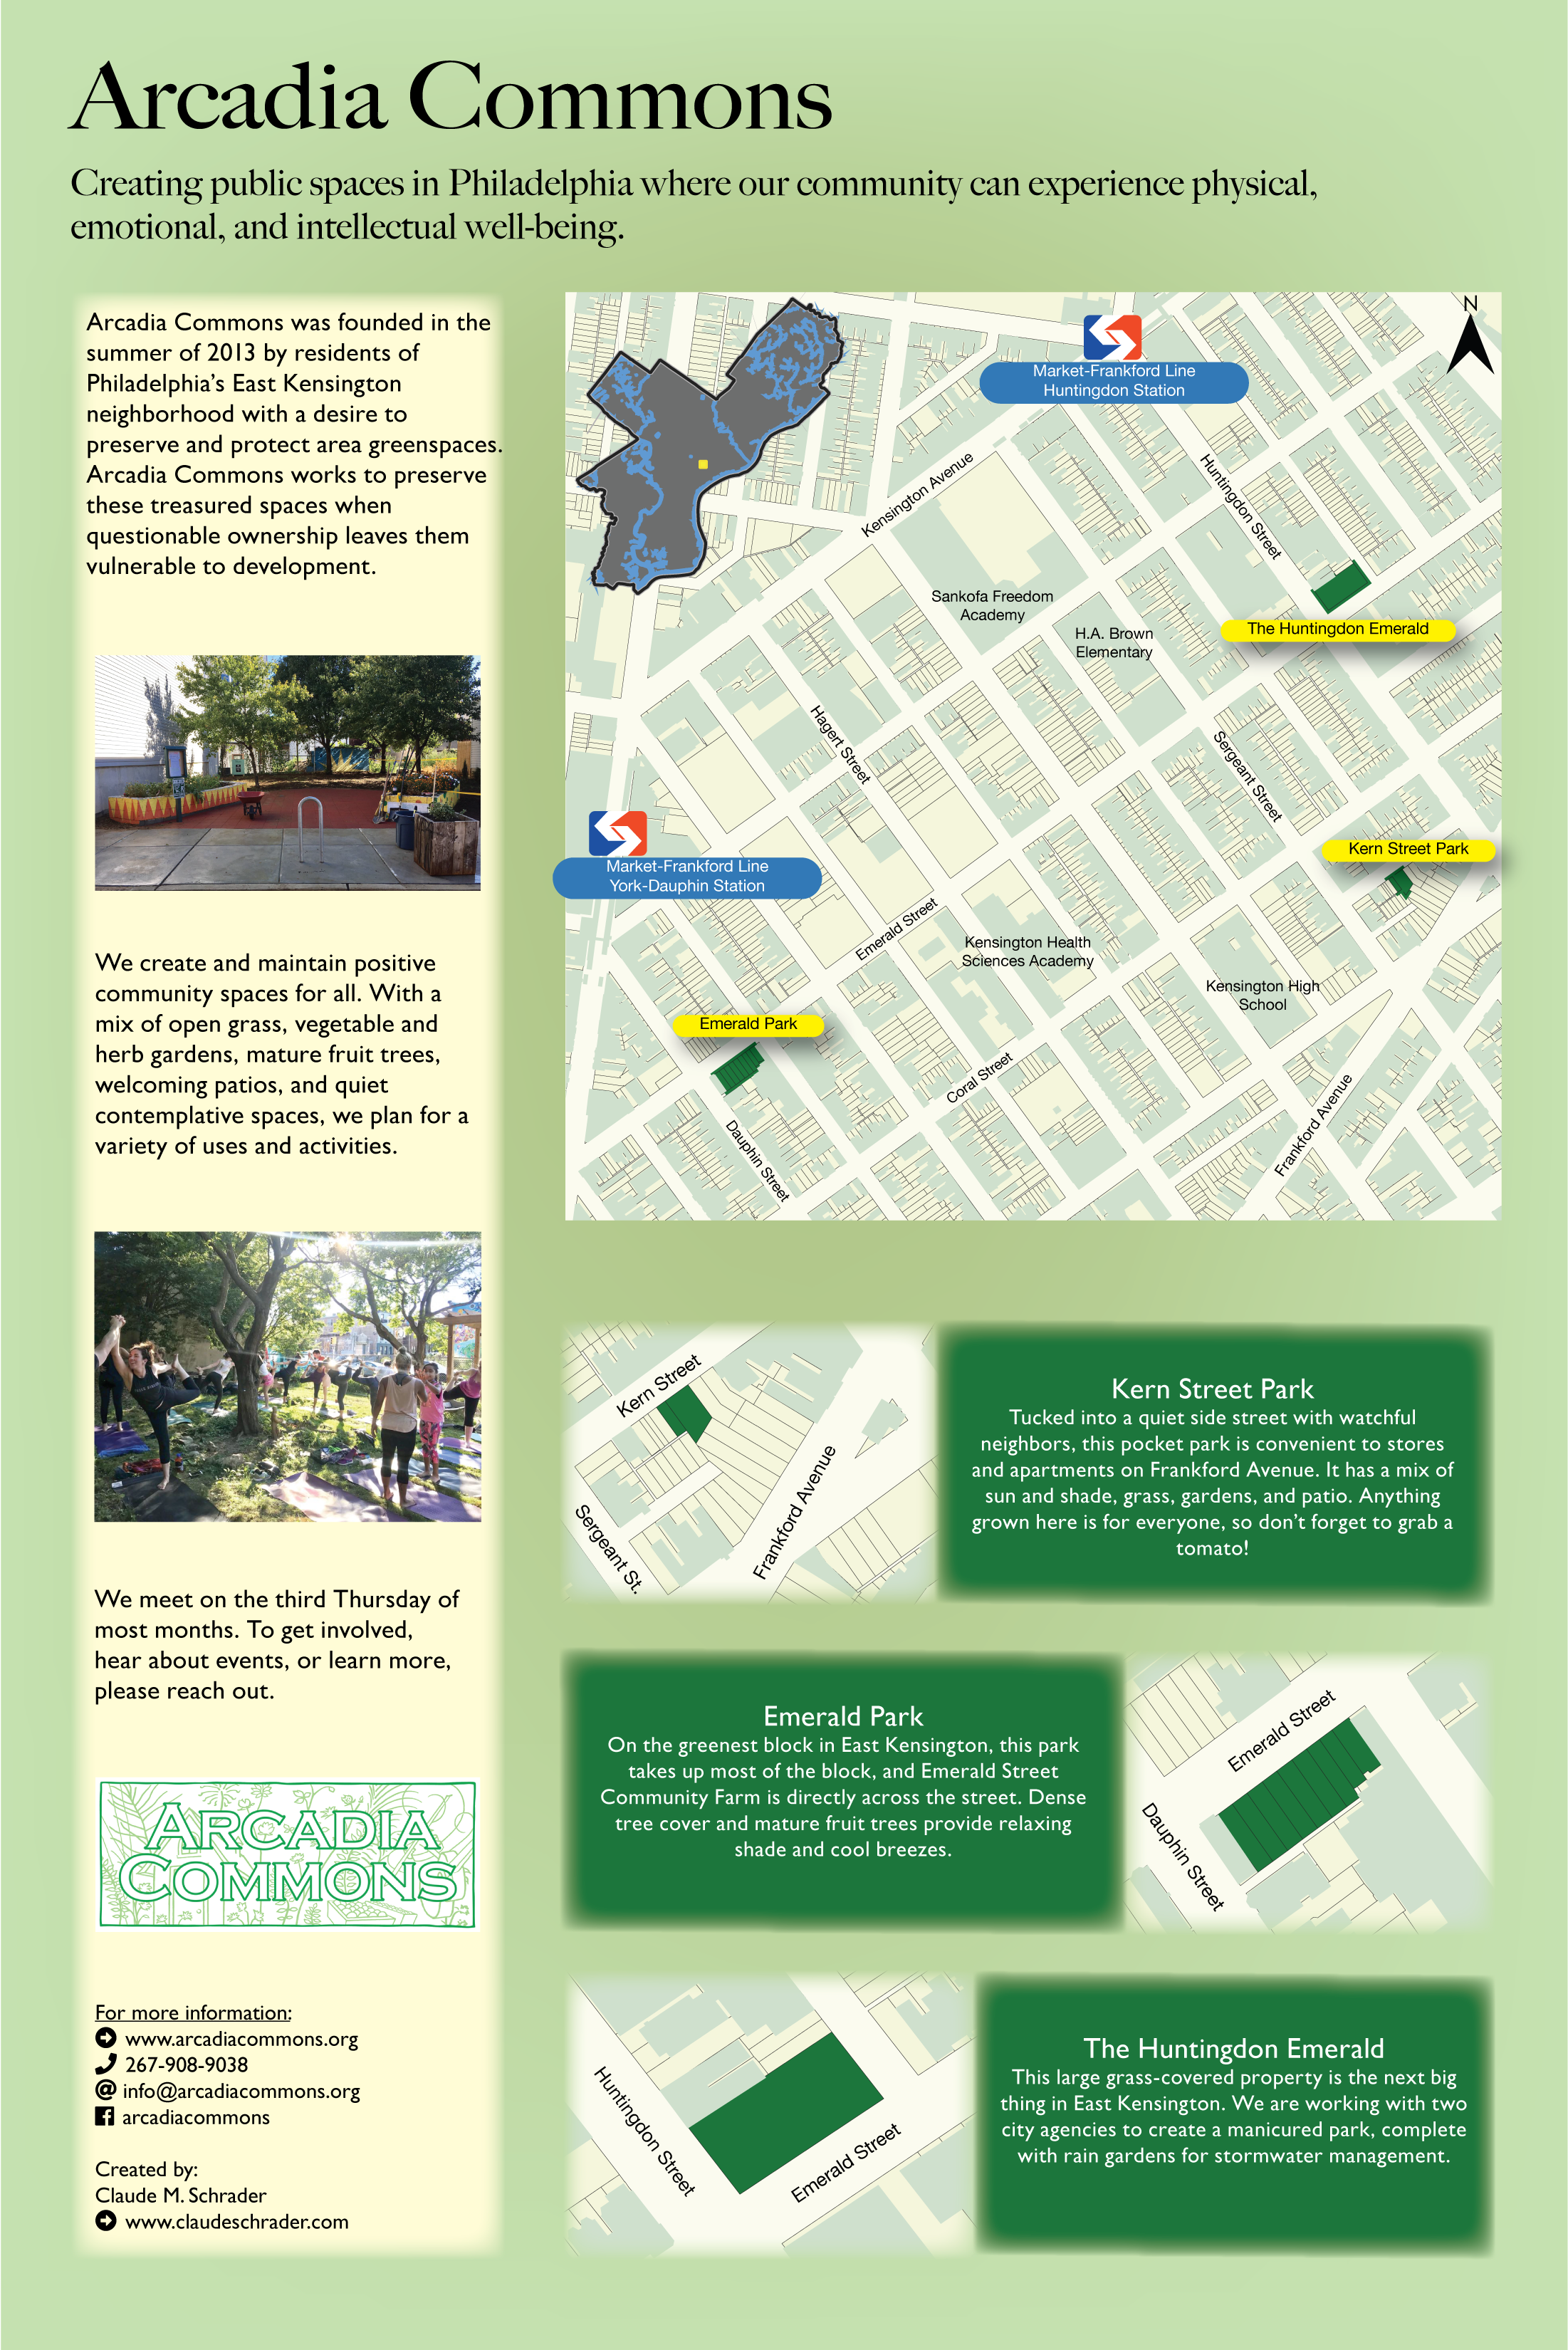
I’m on the board of Arcadia Commons, a local nonprofit formed in 2013 to protect and care for greenspaces around East Kensington. This is a large poster I created to help visualize our area of focus, and the organization’s mission.

Figure 1