Controlling ArcGIS Desktop with Python
Intro
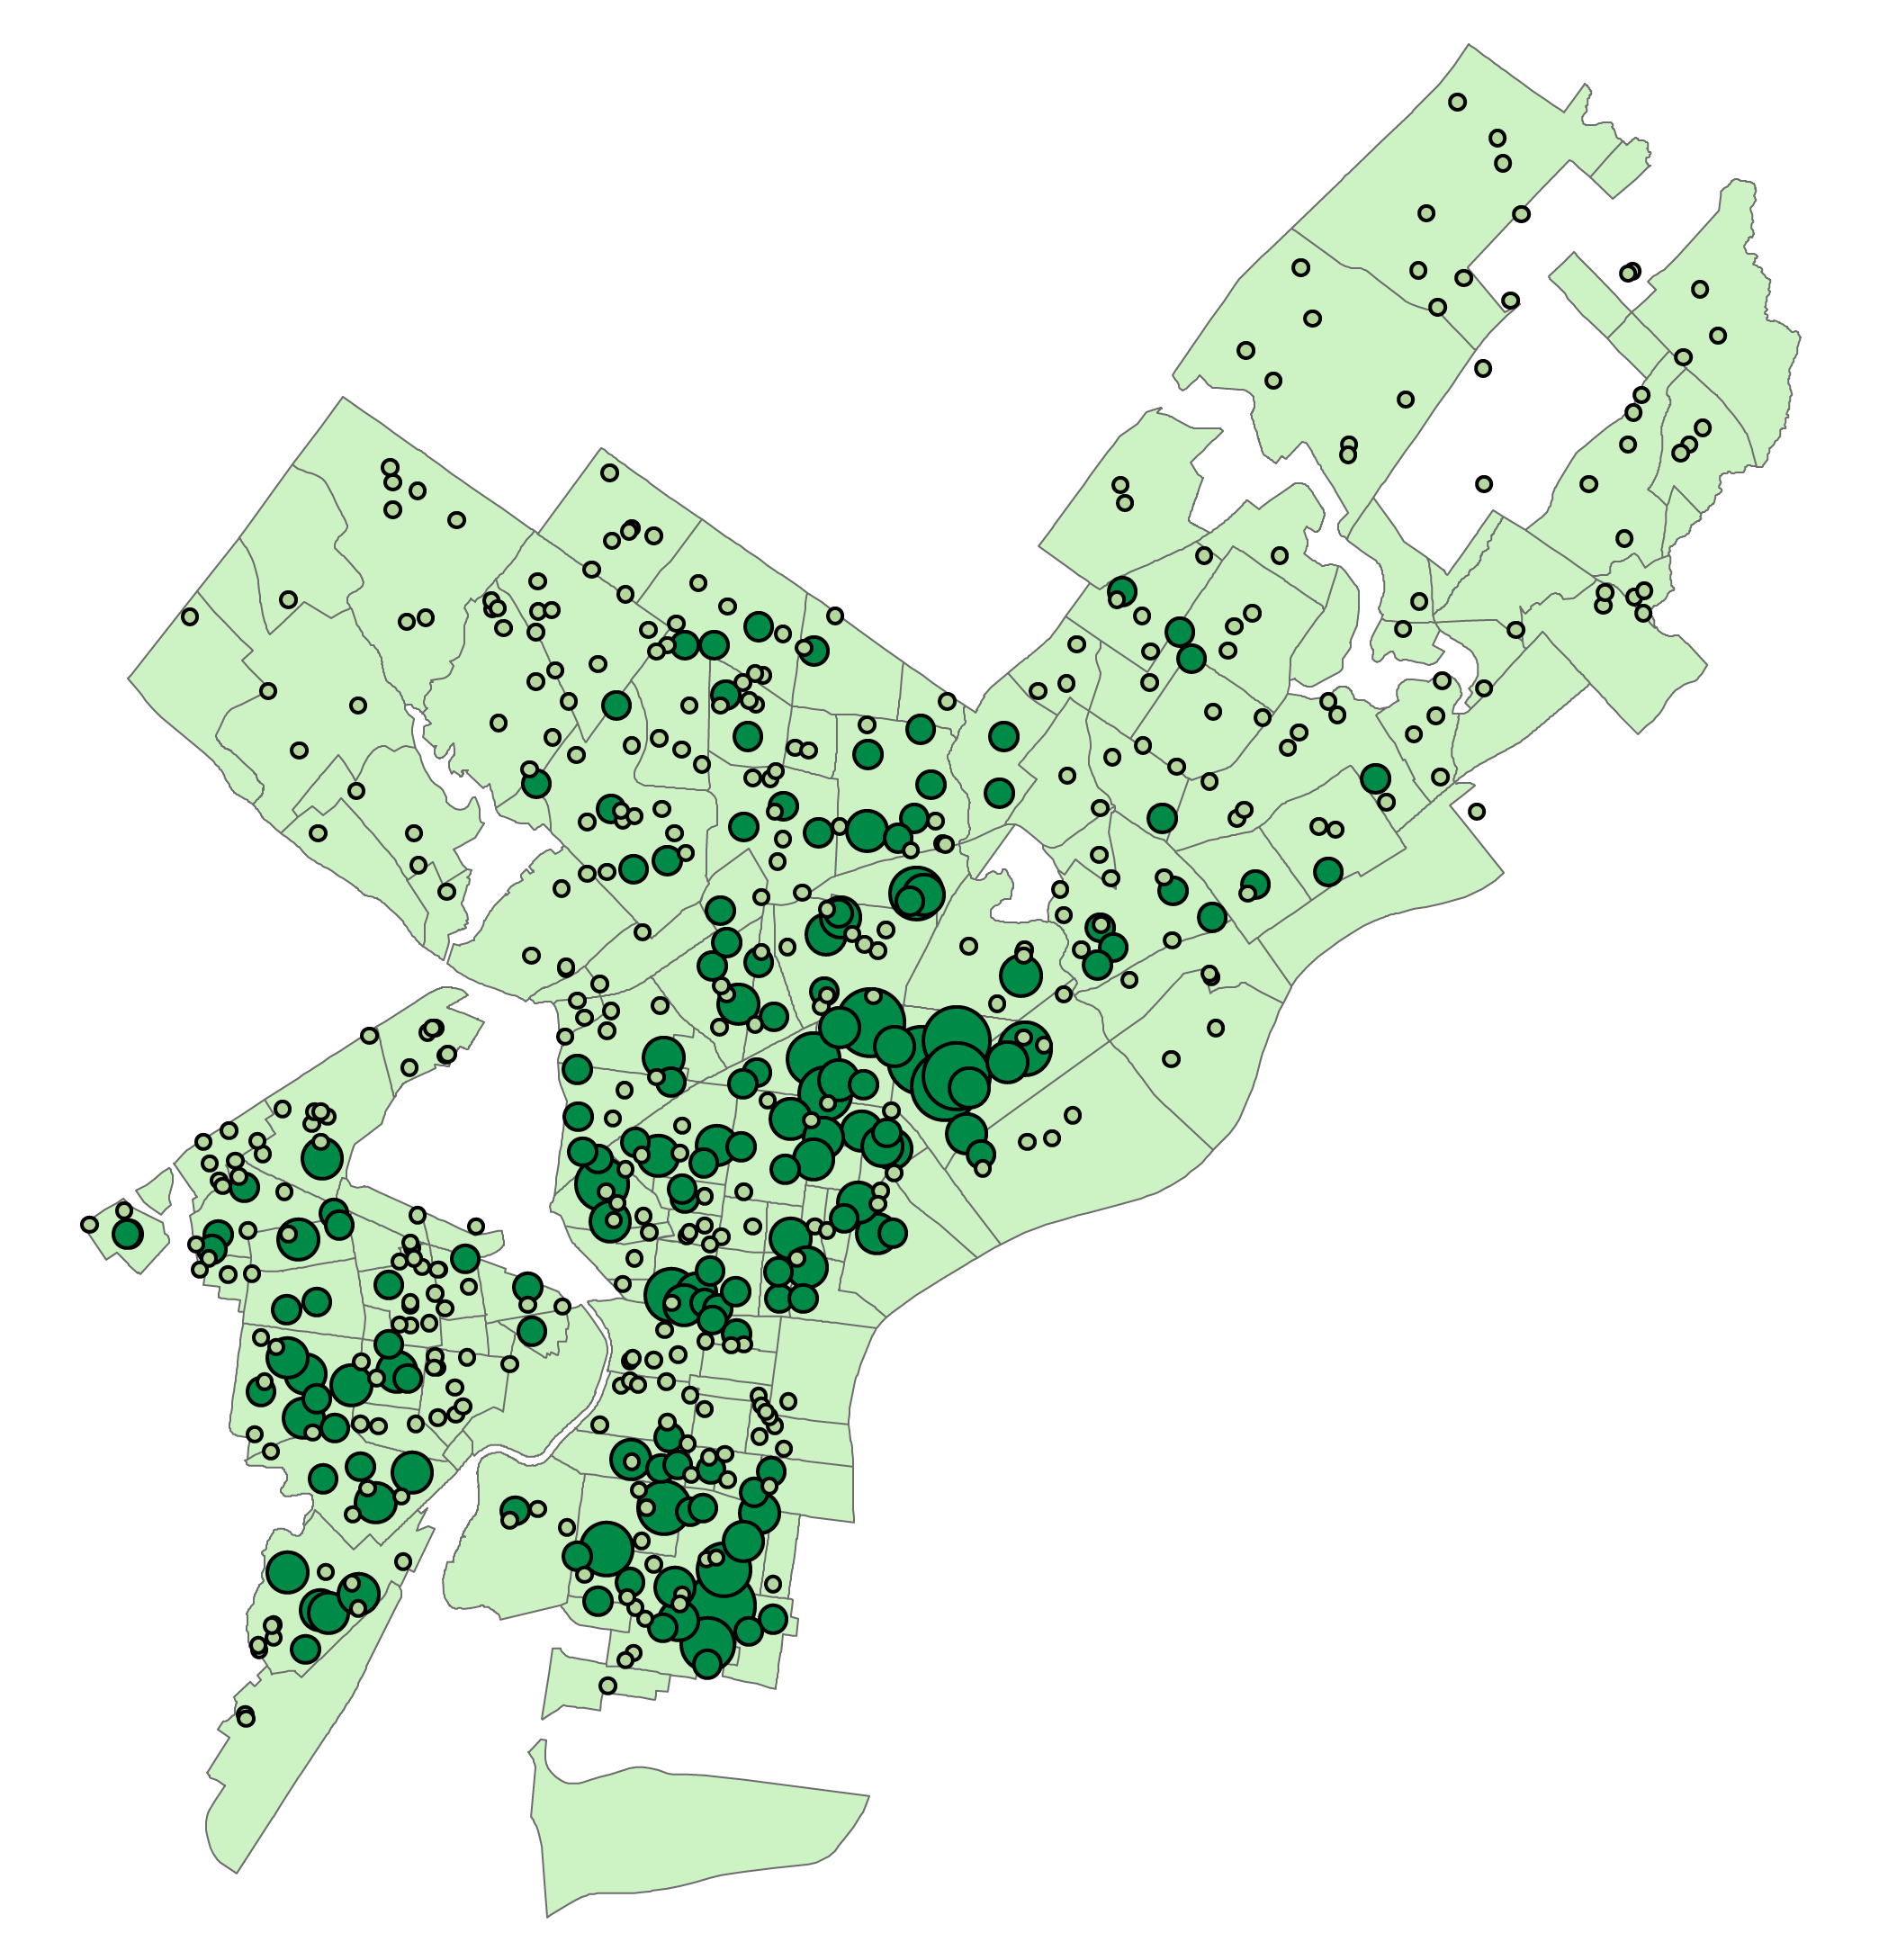
As part of Temple University’s GIS Application Development with Python class, this project was completed as part of the final project. The goal was: create one python script to download and decompress all necessary data, use the ArcPy package to perform some spatial analysis with ArcGIS Desktop, and create a map using the arcpy.mapping module. The mapping module is pretty limited, so the programmatically created map is not a finished product.
I decided to analyze the distribution of healthy corner stores within 300 Meters of each school in Philadelphia using publicly available data.
The script created for this project is stored on Github
Data
All spatial was downloaded as shape files from PASDA:
Healthy Corner Stores
Schools
Neighborhoods
.lyr template
All code and template files for this project are stored on GitHub.
Methods
The Python environment with Python 2.7, ArcPy, ArcGIS Desktop 10.5.1, and Anaconda was installed according to the instructions provided to the class.
The os, urllib2, and zipfile modules were also necessary for this analysis.
Initially, it is necessary to load necessary modules and setting up a number of variables. These mostly concern the URLs and filesystem paths for files downloaded and created.
The first function, fetch_data is used to download data.
- This function is called from a list comprehension for each URL, so it runs four times.
- Download the requested file using the urllib2 module, saving it to the given path.
- Decompress that file if the filename ends with .zip.
The second function, spatial_analysis is where the actual analysis is performed.
- Set up arcpy options and necessary variables.
- Create a 300 meter buffer around each school.
- Perform a Spatial Join to count the number of healthy corner stores that fall within the between the schools buffer.
- Use the Join Field tool to insert the count of healthy stores within each school buffer into the original Schools shape file from PASDA.
The third function, make_map is where the final updated map is created and saved as a PDF.
- Set up arcpy options and necessary variables.
- Create an ArcGIS data frame to populate with layers.
- Create a layer for the neighborhoods shape file as a basemap.
- Create a layer for the newly modified schools shape file.
- To accomplish the necessary symbology for this map, we had to manually create it beforehand in ArcMap, saving it as a .lyr file. This script simply imports the symbology from that file and copies it to our newly created map. This is a limitation of the mapping module, as it is designed more for modifying and updating maps, rather than creating them from scratch.
- Move the neighborhoods layer to the bottom of the data frame, and the schools layer to the top.
- Export our map as a PDF.
- Save our .mxd file to disk.


